Go to documentation repository
Page History
...
| Section | |||||||||||||||||||||
|---|---|---|---|---|---|---|---|---|---|---|---|---|---|---|---|---|---|---|---|---|---|
|
| Tip |
|---|
Information about Incident manager events is displayed in the events table located in the upper part of the window.
You can group, filter, and sort the events. The list displays the event status, and you can take the event into processing from there (see Processing events).
When you open the Incident manager, the events Monitoring mode opens by default, which displays only current events that need to be processed. To view all Incident manager events, go to the Archive.
Viewing current events
The following information is displayed for each event by default:
...
By default, an event has an empty status in the Incident manager. Eventually, an event may receive the following statuses, depending on the operator actions (see Processing events):
- Acknowledged. This status is displayed if an event is taken into processing and is currently being processed.
- Suspended. This status is displayed if event processing was started and not completed but suspended.
- Taken by others/<Last name of the operator who took the event into processing>. This status is displayed if the event is being processed by another operator.
- Suspended by others. This status is displayed if event processing was started and not completed but suspended by another operator.
- Escalated. This status is displayed if the event was escalated to another operator. The following options are available:
- Escalated/Suspended by others — status immediately after escalation.
Escalated/Taken by others — the escalated event was taken into processing by another operator.
Info title Note Depending on the Incident manager settings, when an event is escalated, it may not change its status, but disappear from the list of the person who escalated the event.
- Escalated/<Last name of the operator who escalated the event>. This status is displayed to the operator to whom the event was escalated.
- Escalated/Acknowledged. This status is displayed to the operator to whom the event was escalated when he took it into processing.
...
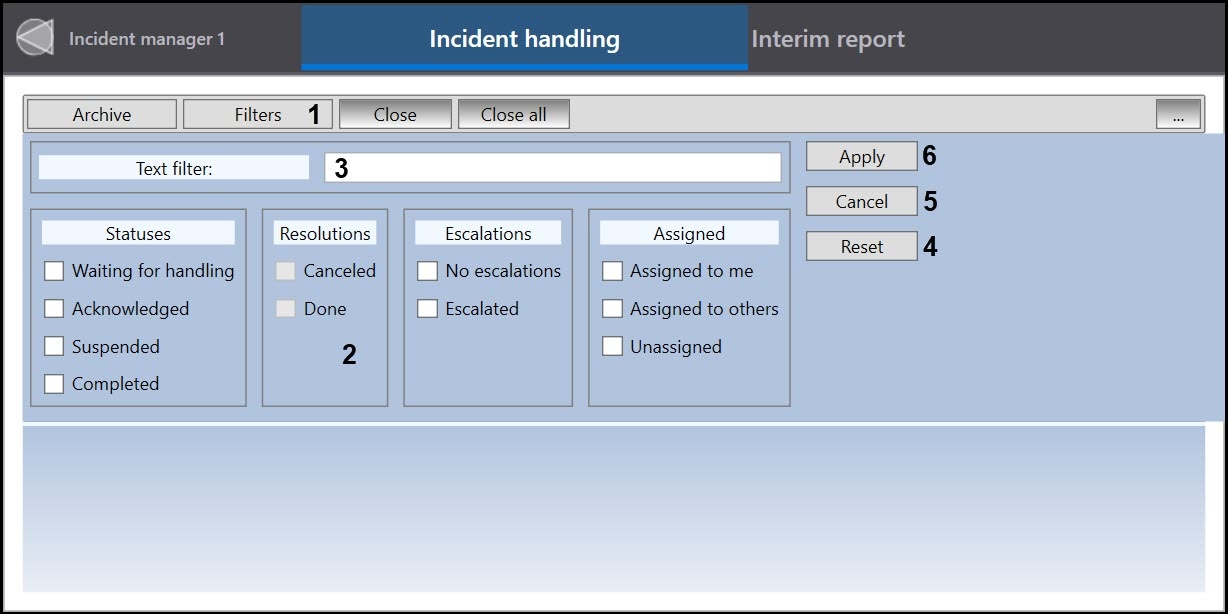
- Click the Filters button (1).
- Apply the filter in one of the following ways:
Set the checkboxes next to those values in the column values columns by which you want to filter out the events (2). As a result, only those objects that match all the filter criteria at the same time will be displayed. To clear all selected checkboxes, click the Reset button (4).
Info title Note In order to display the events assigned to the current Operator or other Operators, it is necessary to set the checkbox next to the Assigned to me or Assigned to others value in the Assigned column, respectively. In order to display the events assigned to both the current Operator and other Operators, set the checkboxes next to both the Assigned to me and Assigned to others values.
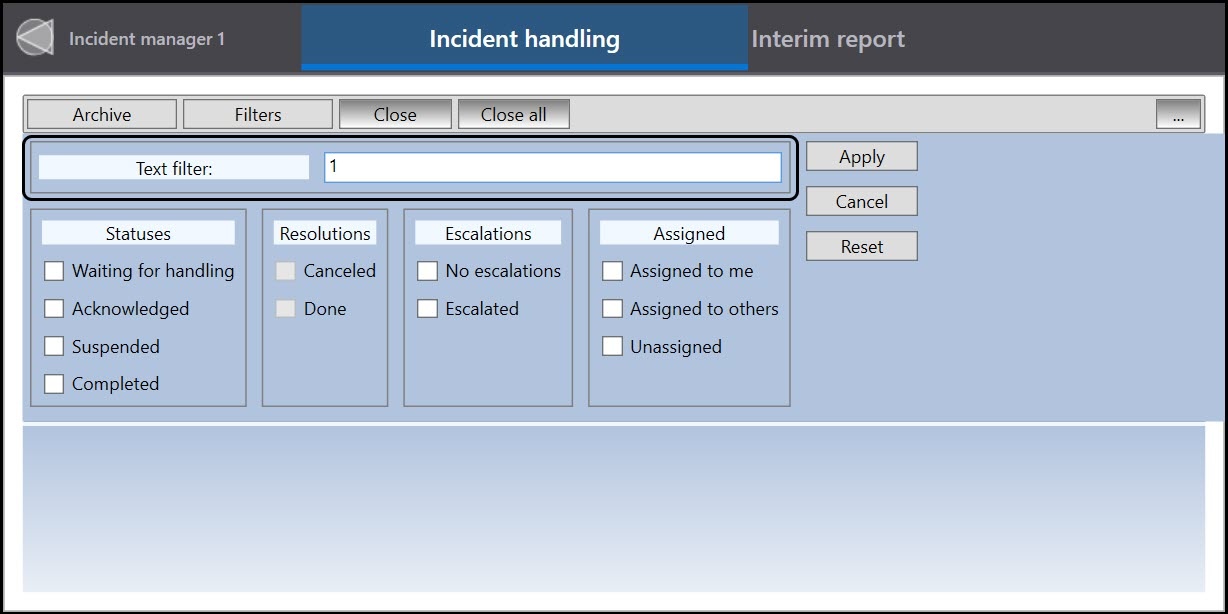
- In the Text filter field, enter the object name, object ID, or the action of the event (for example, Activated), by which you want to filter out the events (3). It is not necessary to enter full object name, object ID, or action. The filter will display all found matches based on the value entered in the Text filter field. To delete the entered value, click the Cancel button (5).
- Apply the filter using both the checkboxes and text at the same time. To do this, enter the object name, object ID, or the action of the event (3) in the Text filter field. Then , and set the checkboxes next to the column values by which you want to filter out the events (2). As a result, events that match both the entered text and the selected checkboxes will be filtered out. To clear all selected checkboxes and delete the entered value in the field, click the Cancel button (5).
- Click the Apply button (6).
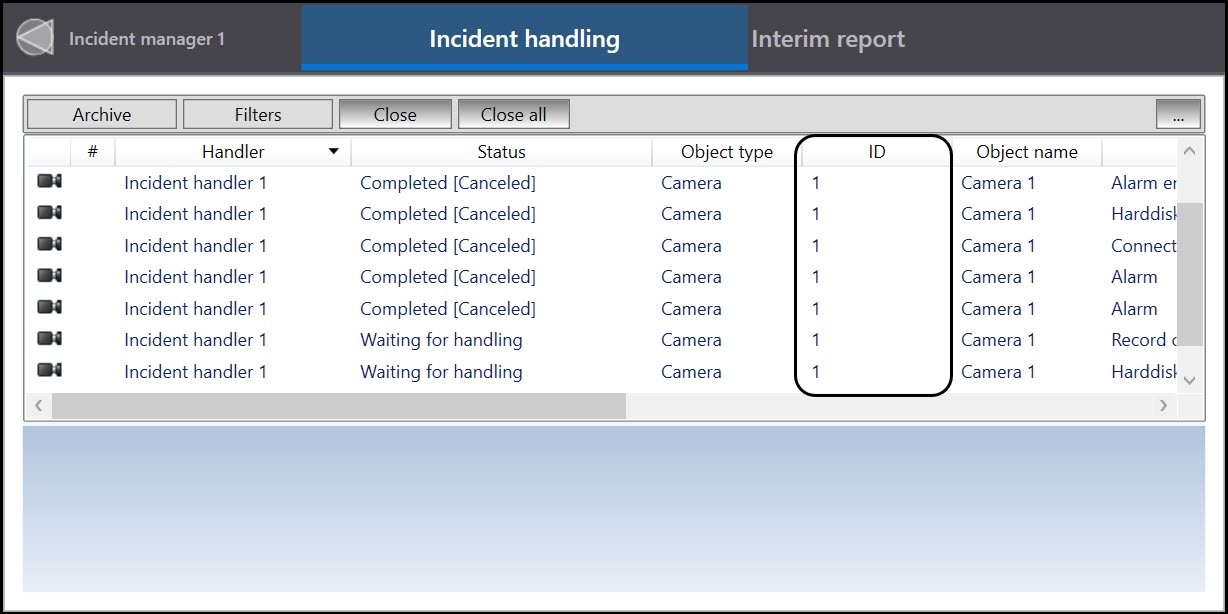
As a result, only those objects and events that match all the filter criteria at the same time will be displayedselected filter criteria will be displayed. For example, if the checkboxes next to the Acknowledged and Assigned to me statuses are set, then all work events that are assigned to the current user will be displayed.
| Info | ||
|---|---|---|
| ||
If you set all the check boxes in the Statuses column, it will mean the same as if none is set. The same applies to the Assigned column. |
Example of applying the event filter by object ID:
| Anchor | ||||
|---|---|---|---|---|
|
To go to the events archive, click the button on the top panel. As a result, a list of archived events will open:
In the events archive mode, you can do the same actions as in the events Monitoring mode: apply filters, use the Close and Close all buttons, generate an interim report, and select columns to be displayed in the table. Besides that, on the top panel you can set the parameters for displaying the archive:
where:
- the period for displaying the archived events is specified by the date and time of its beginning (1) and end (2);
- the Refresh button is used to update the events list if the display period has changed (3);
- item 6 is the number of the displayed page;
- item 7 is the total number of pages;
- buttons < and > are used to go to the previous/next page (5 and 8);
- buttons << and >> are used- to go to the first/last page (4 and 9).
To return to current events, click the button.


