...
The Face counter report (common report by all counting points) allows getting allows you to get data about the number of captured faces (people/persons) using the visitors) using the data from the face recognition servers. The data can be presented as a table and a chart.
| Info |
|---|
|
The Face counter report (common report by all counting points) is related to the is part of the Face recognition server object, it is necessary to create . You must first create the corresponding object in Face PSIM(see Configuring the Face recognition server object). |
To create the Face counter report (common report by all counting points), do the following:
- Select the Face counter report (common report by all counting points) (see Select the type of Visitors counting detectors reports). As a result, the dialog box for specifying the report parameters will be displayed.
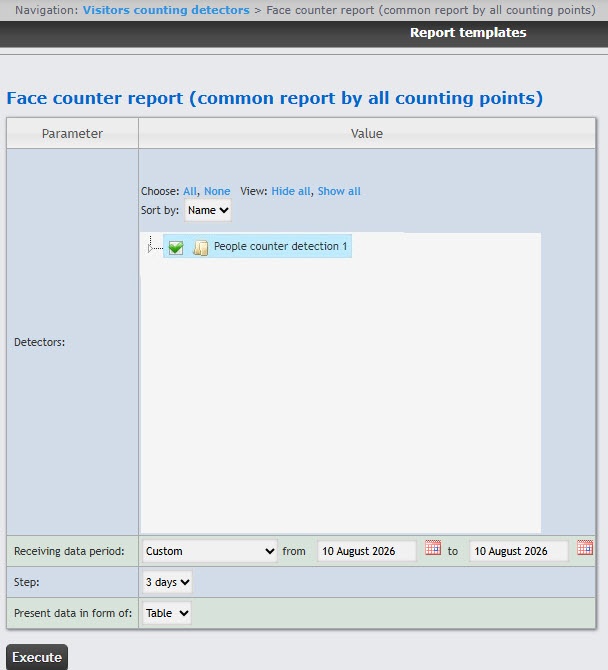
- In the Detectors
field - field, set the checkboxes
in - next to those Face recognition server objects
information on which should be displayed in the report- whose information you want to include in the report. To select all found servers, click All; to deselect, click None. To expand the server structure, click Show all; to collapse, click Hide all.
- By default, the
detectors - detector list is sorted by name. To sort by number, select this option from the Sort by drop-down list.
- From
the - the Receiving data period drop-down list, select the time period for which the report
is to - must be created.
- If
the Custom period is selected- you select the Custom period, enter the
- dates of the start and end periods for which the report
- must be created in
- the from and to fields using the Calendar
 Image Removed button near the corresponding field to use the Calendar
 - tool.
- From the Step drop-down
list select - list, select the time period during which the
values received from people counter detector will be summed (depends on the Receiving data period parameter).- data from the face recognition server is summarized.
- By default, the data is presented in the form of a table. To present the data in the form of a graph, select this option from
From - the Present data in form of drop-down list
, select the report format: Table or Graph- .
- To create
a - the report
click - , click the Execute button.
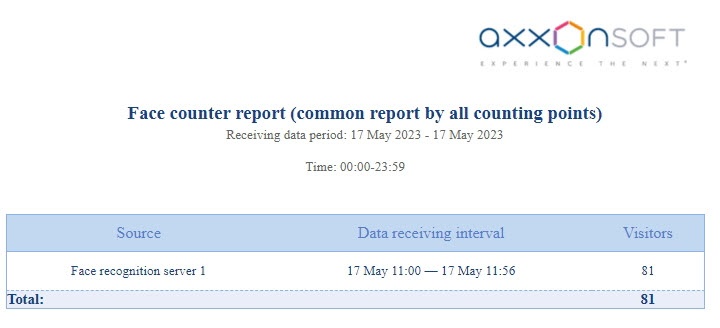
Example of a face counter report by all counting points as a table is given in the following figure.
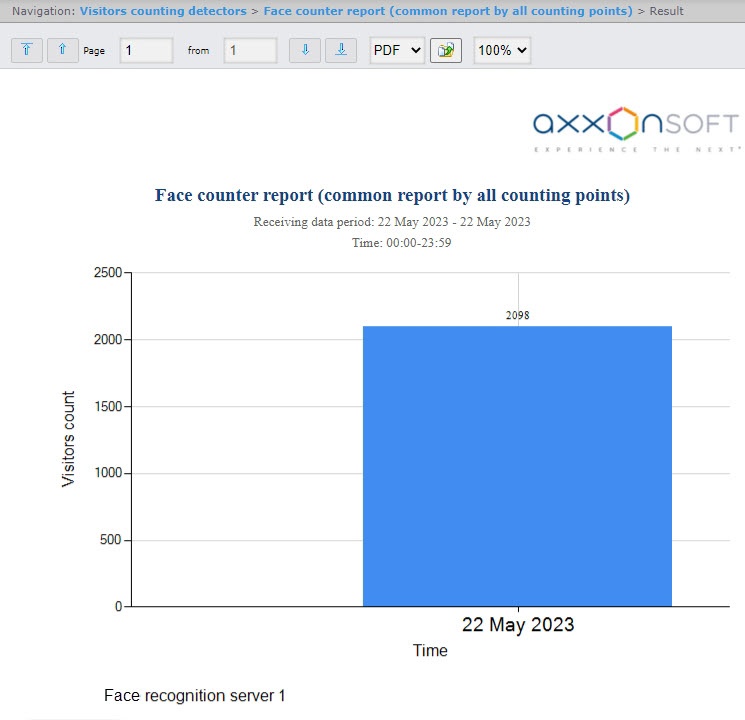
Example of a face counter report by all counting points as a graph is given in the following figure.
| Info |
|---|
|
The number of people (persons) visitors in the report means the number of captured faces, not the number of unique visitors. |
...
...