Versions Compared

Key

  • This line was added.
  • This line was removed.
  • Formatting was changed.

...

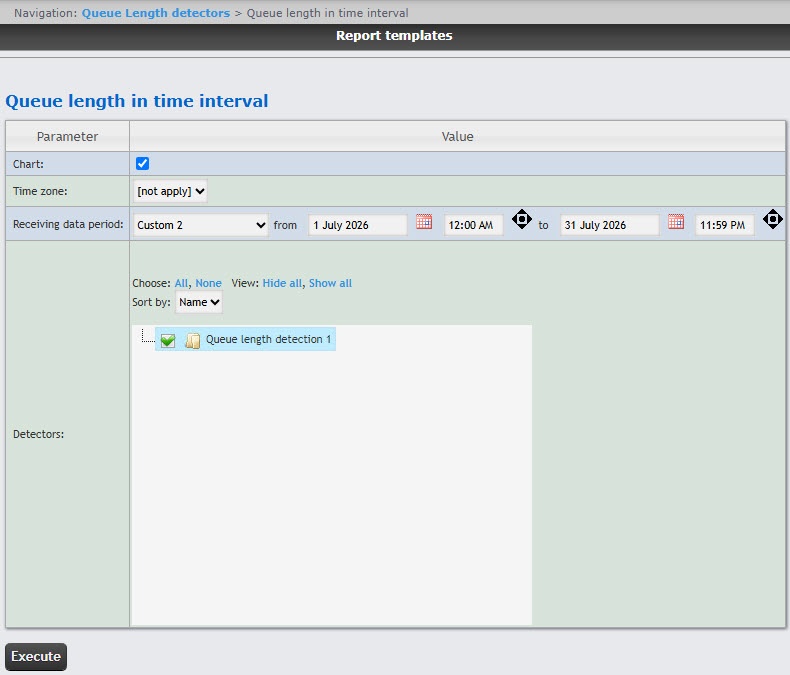
  1. Select the Queue length in time interval report type (see Select the type of Queue Length detectors reports).
  2. Set the Chart checkbox if you want to create the report in the form of a chart.
  3. From the Time zone drop-down list, select the time zone for which the report must be created.

    Info
    titleNote

    You can select time zones created in Axxon PSIM that have only one time period and don't have any nested time periods. You cannot select days of the week. For detailed information about creation and using time zones, see Creating and using time schedules.

  4. From the Receiving data period drop-down list, select the time period for which the report must be created.
    1. If you select the Custom or Custom 2 time period, enter the start and end dates of the time period for which the report must be created in the from and to fields using the Calendar tool.
    2. If you select the Custom 2 period, additionally enter the start and end time of the period.
  5. In the Detectors field, set the checkboxes next to those Queue length detection objects whose information you want to include in the report. Click All to select all available detectors, click None to deselect. Click Show all to expand the detector structure. Click Hide all to hide the structure.
  6. By default, the list of detectors is sorted by name. To sort by number, select this option from the Sort by drop-down list.
  7. To create the report, click the Execute button.
    As a result, the report by the queue length in time interval with the specified parameters is displayed. The data is displayed with averaging depending on the selected time interval. If you select more than 14 days, the data averaging is one day. If you select from one day to 14 days, the data averaging is one hour. If you select less than one day, the data averaging is one minute.

...