...
To create the Queue length threshold crossing report, do the following:
- Select the Queue length threshold crossing report (see Select the type of Queue Length detectors reports) from the list of the available Queue Length detectors reports.
From the Receiving data period drop-down list, select the time period for which the report should must be created.
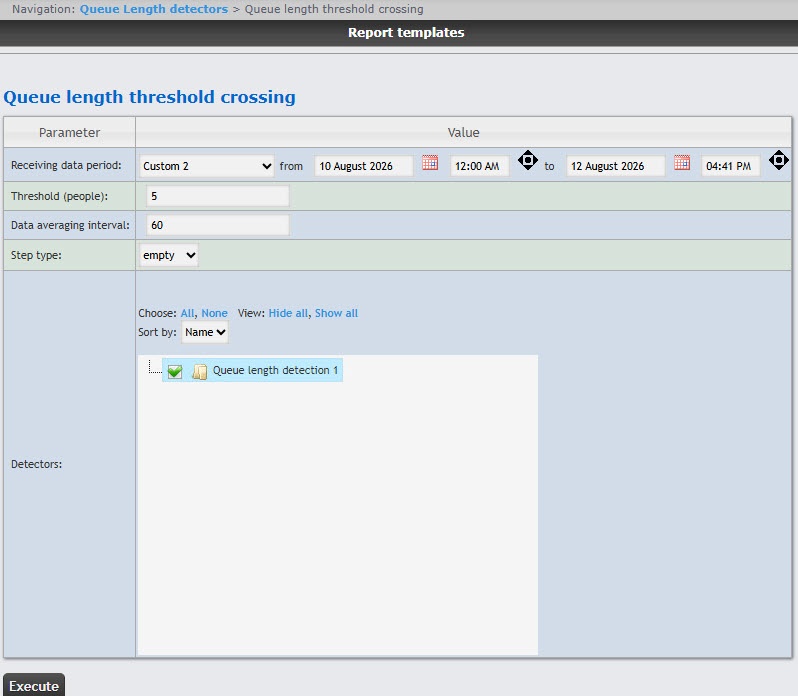 Image Removed
info |
If you select the Custom or Custom 2 time period
is selected, enter the date of the start and end periods for which the report
should must be created in the from and to fields using the Calendar tool.
Click the  Image Removed button near the corresponding field to use the Calendar tool. It is also necessary to
 If you select the Custom 2 time period, enter the time of the start and end
period using the  Image Removed button
periods.
Image Added
- In the Threshold (people) field, set the number of people in the queue , which that is considered maximum.
- In the Data averaging interval field, enter the calculation step of the queue length—the time interval between the congestion values of the monitored area. The report displays the average values of the queue length over a time equal to the calculation step. The maximum and minimum values of this field depend on the selected step type.
- From the Step type drop-down list, select the type of data averaging:
- empty—the data will be displayed as is, i.e., it won't be averaged. The Data averaging interval field isnfield isn't taken into account;.
- seconds—the data will be averaged by seconds with a step in the range of 1-60 from the Data averaging interval field;.
- minutes—the data will be averaged by minutes with a step in the range of 1-60 from the Data averaging interval field;.
- hours—the data will be averaged by hours with a step in the range of 1-24 from the Data averaging interval field;.
- days—the data will be averaged by days with a step in the range of 1-31 from the Data averaging interval field.
- In the Detectors field, set the checkboxes next to those Queue length detection objects, the information from which should be displayed whose information you want to include in the report. Click All to select all found/ available detectors, click None to deselect. Click Show all to expand the detectors detector structure. Click Hide all to hide the structure.
- By default, the list of detectors is sorted by name. To sort by number, select this option from the Sort by drop-down list.
- From the Sort by drop-down list, select how the data will be sorted in the report: by detector Name (selected by default) or by the detector Number.
- To create a the report, click the Execute button.
As a result, a report on all recorded facts of exceeding the queue length for the specified period will be displayed.
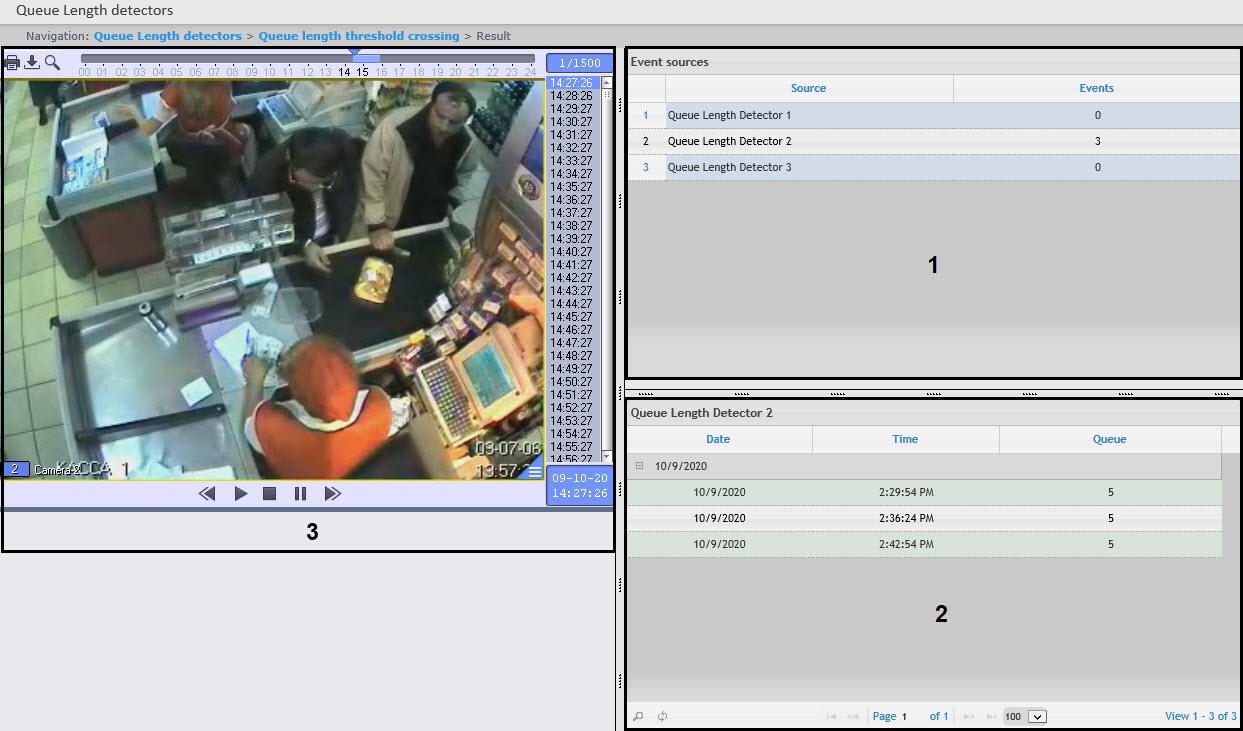
The report has three sections:
- Section 1 displays a list of queue length detectors that have recorded the events of exceeding the threshold of queue length for the specified period , and the number of recorded events.
- Section 2 displays a detailed table of events recorded by the detector selected in section 1, the time of recording for each event, and the number of people in the queue at the specified time. The maximum number of entries on one page of the table is 100.
- Section 3 displays a video recording of the event selected in section 2.
The Queue length threshold crossing report is created.