Go to documentation repository
...
The Face counter report (detailed by detectors) allows getting you to get the data about the number of captured faces (people/personsvisitors) using the data from the face detectors. The data can be presented as a table or as a graph.
| Info | ||
|---|---|---|
| ||
The Face counter report (detailed by detectors) is related to the Face Detection object (it is necessary to create is a part of the Face Detection object. You must first create the corresponding object in the Face PSIM software (see Configuring the Face Detection module). |
To create the Face counter report (detailed by detectors), do the following:
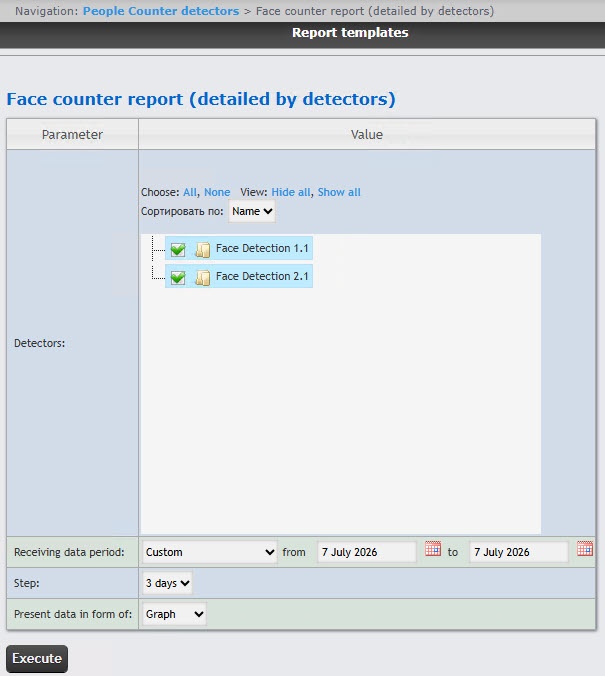
In the Detectors field, set checkboxes for next to those Face Detection objects , the information on which should be displayed whose information you want to include in the report. Click All to select all found or available objectsdetectors. Click None to deselect. Click Show all to expand the object detector structure. Click Hide all to hide the object detector structure.
 button near the corresponding field to use the Calendar
 Example of the Face counter report (detailed by detectors)as a table is given in the following figure.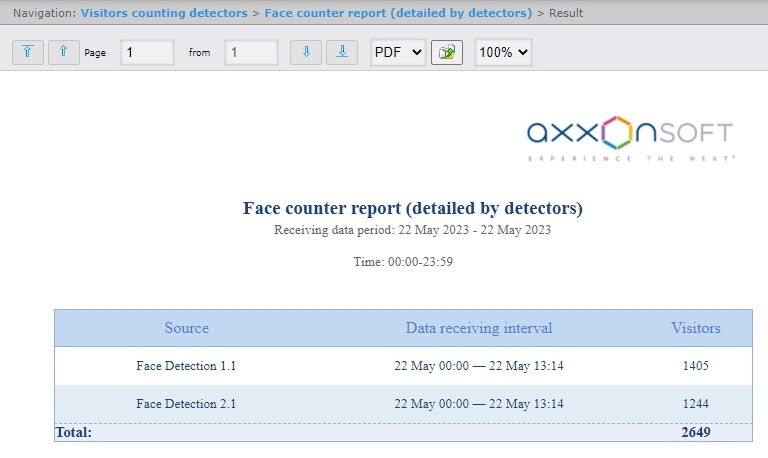
| Info | ||
|---|---|---|
| ||
The number of people (persons) visitors in the report means the number of captured faces, not the number of unique visitors. |
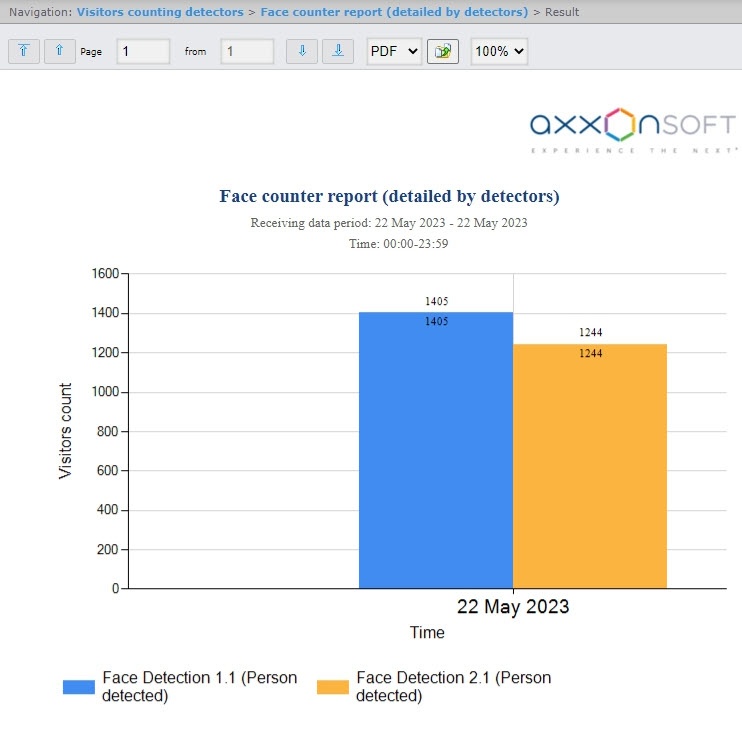
Example of the Face counter report (detailed by detectors)as a graph is given in the following figure.
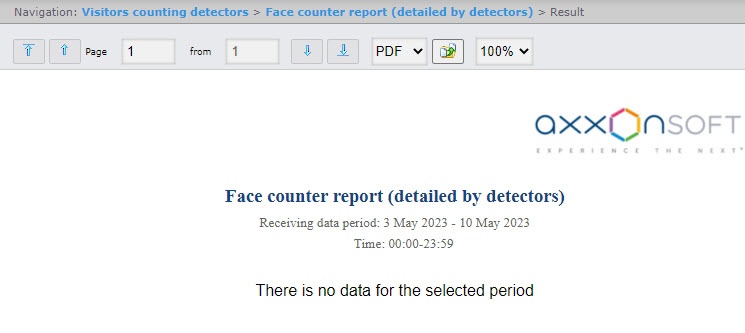
If there is no data for specified time period, the report will be displayed as in the following figure.