
Go to documentation repository
| Info | ||
|---|---|---|
| ||
You can use templates when you create a report. To add a new template, click Report templates→New template and fill in the Name and Description fields. The template will use the selected parameters of the current report. Templates work the same way as templates in the scheduler and can be used interchangeably. When you create a response using a template, click Report templates at the top of the page and select the required template from the list of saved templates (the required template is highlighted). As a result, the parameters of the current report are updated according to the selected template. |
The Average queue length in time interval report provides the information on the average queue length. The data can be presented in the form of a chart or a table.
| Info | ||
|---|---|---|
| ||
The Average queue length in time interval report is a part of the Queue Length detector module (length detection module, it is necessary to create and configure the corresponding object inAxxon PSIM DetectorPack PSIM (see Configuring the Queue length detection module). |
To create the Average queue length in time interval report, do the following:
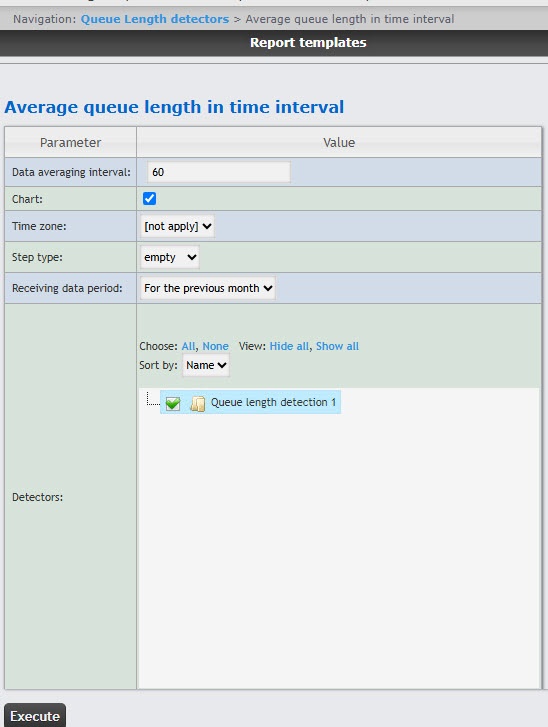
In the Data averaging interval (min.)field (1), enter the calculation step of the queue length—the time interval between the congestion values of the monitored area. The report displays the average values of the queue length over a time equal to the calculation step. The maximum and minimum values of this field depend on the selected step Step type (4)parameter.
| Info | ||
|---|---|---|
| ||
If the average value is zero for all such intervals over a specified period, that period will not be displayed in the report. In this case, it is recommended to change the data averaging interval. |
From the Time zone drop-down list (3), select the time zone for which the report should must be created.
| Info | ||
|---|---|---|
| ||
You can select time zones created in Axxon PSIM that have only one time period and don't have any nested time periods. You cannot select days of the week. For detailed information about creation and using time zones, see Creating and using time schedules. |
From the Receiving data period drop-down list
, select the time period for which the report
must be created.
| title | Note |
|---|
 button near the corresponding field to use the Calendar tool. For the
  button
Example of the report in the form of a table:.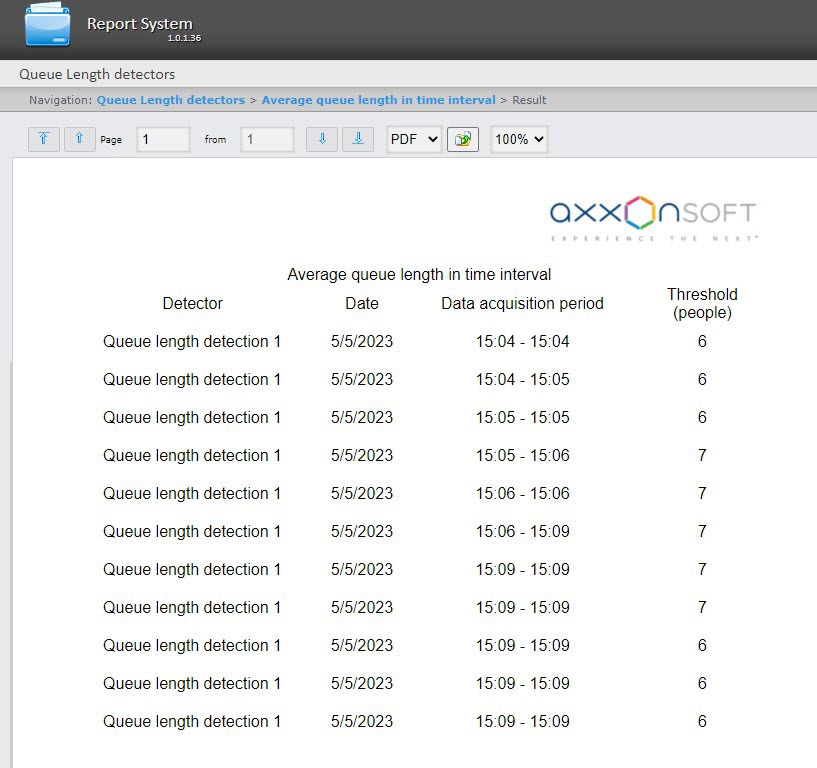
Example of the report in the form of a chart:.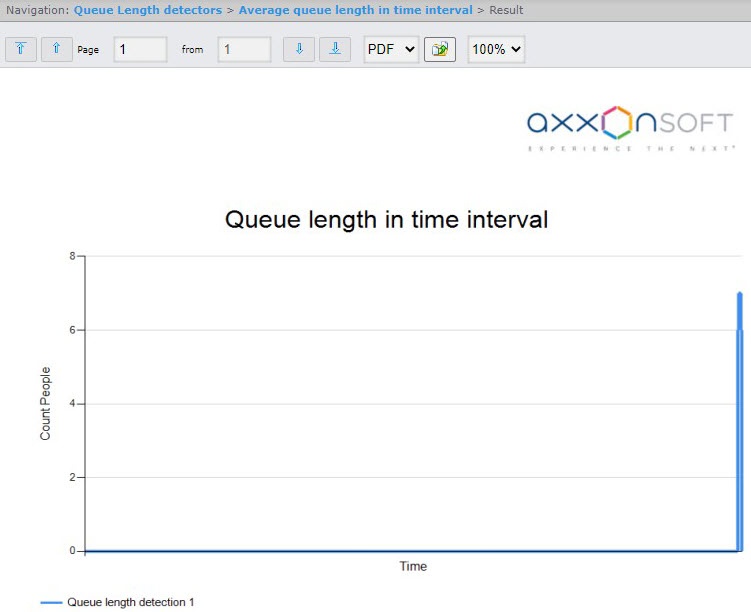
| Info | ||
|---|---|---|
| ||
If more than one detector is used, the data from each detector will be displayed in a different color. |

