
Go to documentation repository
| Info | ||
|---|---|---|
| ||
You can use templates when you create a report. To add a new template, click Report templates→New template and fill in the Name and Description fields. The template will use the selected parameters of the current report. Templates work the same way as templates in the scheduler and can be used interchangeably. When you create a response using a template, click Report templates at the top of the page and select the required template from the list of saved templates (the required template is highlighted). As a result, the parameters of the current report are updated according to the selected template. |
| Info | ||
|---|---|---|
| ||
The Heat map is related to the Heat map detection module, it is necessary to create and configure the corresponding object in DetectorPack PSIM (see Configuring the Heat map detection module). |
To generate To create the Heat map report, do the following:
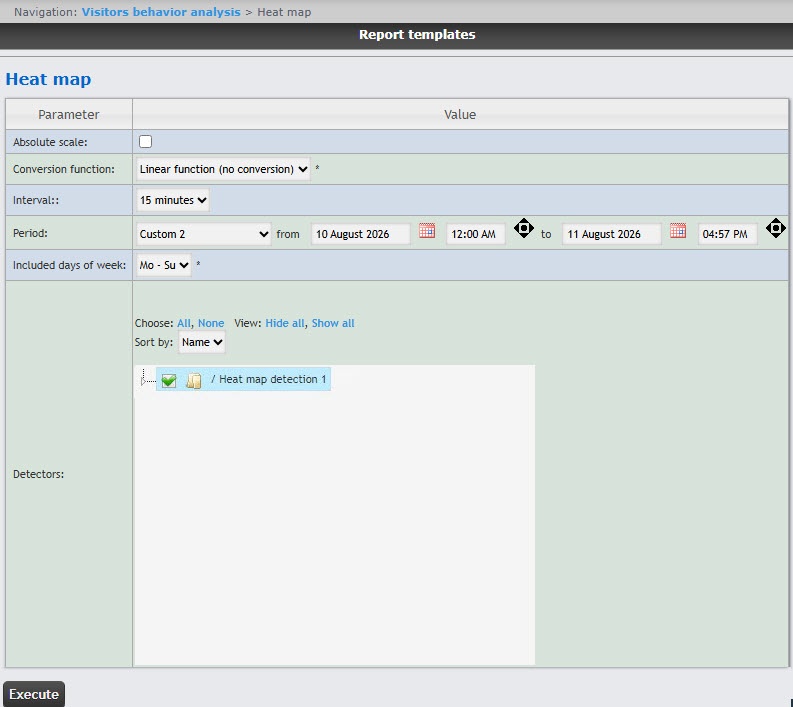
Set the Absolute scale checkbox
if it is required to
display initial data without any changes. By default, the checkbox isn't set.
| Info | ||
|---|---|---|
|
We recommend using this option only when there is high customer activity in the store. If customer activity is low, |
we don't recommend setting the Absolute scale checkbox. If a person is in the area 100% of the time, then the area will be red |
; if the person is not in the area at all, then the area will not be colored. |
The record shows |
that a person |
cannot be in a certain area 100% of the time |
; hence, there will never be red zones. Use the conversion function to better demonstrate this |
. For example, if the customer activity fluctuates in a range from 0% to 20%, then when using the linear function of conversion, each activity value will be multiplied by 100%/20% = 5 and earlier the blue zone corresponding to 20% of activity will be displayed as 100% and colored red, and not blue. Find more information about the conversion functions at http://easings.net/en or https://wiki.multitheftauto.com/wiki/Easing. |
From the Conversion function drop-down list, select the function of converting the initial data into relative units.
| Info | ||
|---|---|---|
| ||
Different conversion functions are used to emphasize various aspects of customer activity statistics. |
 button near the corresponding field to use the Calendar
From the Included days of week drop-down list, select the days when most customers work/don't work to consider in statistics.
| Info | ||
|---|---|---|
| ||
If the data period and the specified included days of the week don't overlap, an empty report |
is created, and a message prompting to change the Included days of week parameter or specify another Period is displayed. |
Example of a Heat map report.
...
Customer activity in different parts of the observed monitored area is highlighted in the corresponding color.

