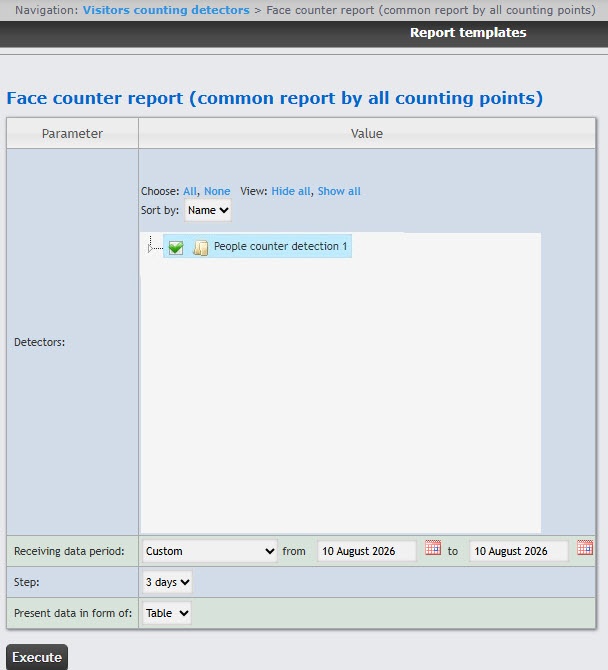
 button near the corresponding field to use the Calendar tool.
You can use templates when you create a report. To add a new template, click Report templates → New template and fill in the Name and Description fields. The template will use the selected parameters of the current report. Templates work the same way as templates in the scheduler and can be used interchangeably. When you create a response using a template, click Report templates at the top of the page and select the required template from the list of saved templates (the required template is highlighted). As a result, the parameters of the current report are updated according to the selected template. |
The Face counter report (common report by all counting points) allows getting data about the number of captured faces (people/persons) using the data from the face recognition servers. The data can be presented as a table and a chart.
The Face counter report (common report by all counting points) is related to the Face recognition server object, it is necessary to create the corresponding object in Face PSIM (see Configuring the Face recognition server object). |
To create the Face counter report (common report by all counting points), do the following:
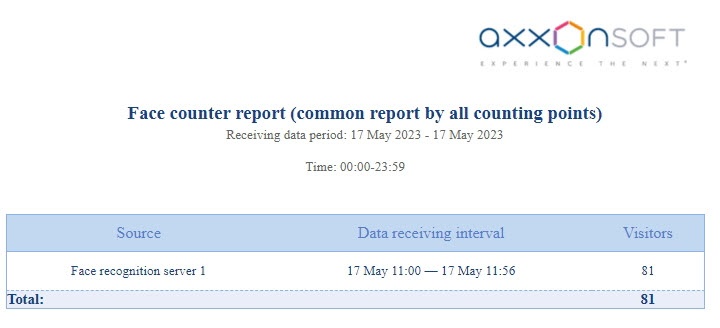
button near the corresponding field to use the Calendar tool.Example of a face counter report by all counting points as a table is given in the following figure.
Example of a face counter report by all counting points as a graph is given in the following figure.
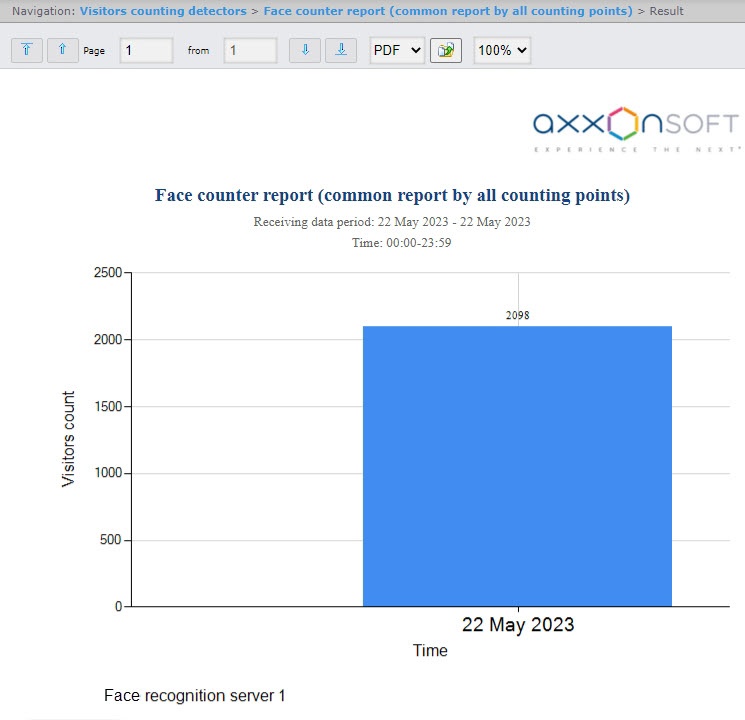
The number of people (persons) in the report means the number of captured faces, not the number of unique visitors. |
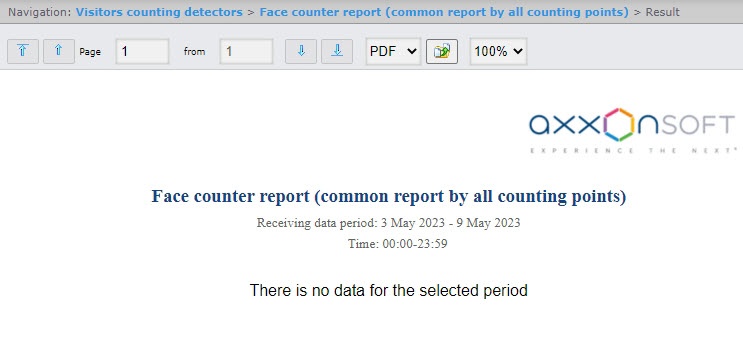
If there is no data for specified time period, the report will be displayed as in the following figure.