Unable to render embedded object: File (books.jpg) not found.
Go to documentation repository
To start generating the report, click the System faults button .
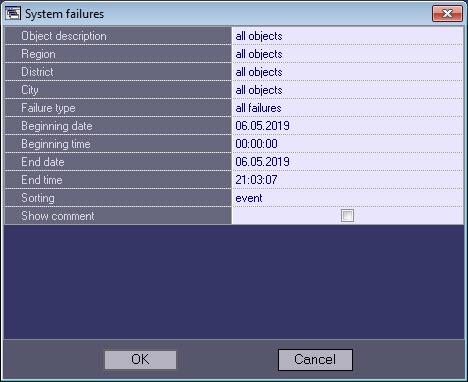
A dialog box then appears, with the parameters necessary for report generation.
This dialog box allows setting the following report parameters:
- Object description. This setting allows switching between the two report modes:
- Report on all system objects
- Report on one system object
- Region, district and city in which the objects are located. This information is configured on the Control panel - see Editing reference information. If a specific object is selected (see step 1), then these fields are hidden in the report settings window.
- Failure type. This setting allows specifying the type of fault for which you want to generate a report. You can also create a report for all faults that occurred during a specified interval of time.
- Beginning date, End date, Beginning time, and End time. This setting is used for specifying the time range of the alarms by which the report will be generated.
- Sorting. A report can be sorted in one of two ways:
- By events (Signal from vibration sensor, Signal from lock sensor, etc.).
- By time of event start.
- Show comment. Set this checkbox if it is necessary to display fault comments in the report (see Processing alarms).
- After configuring all parameters, click OK .
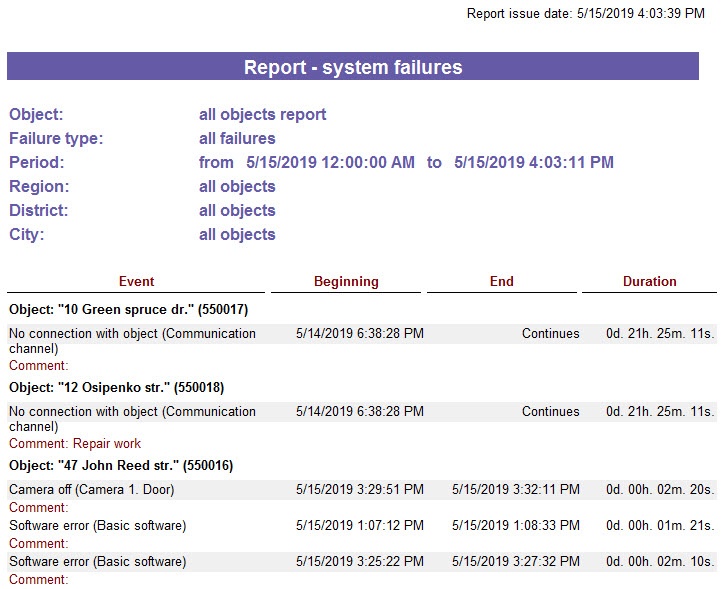
The report appears in a new window.
Each report window has a toolbar:
| No. | Description |
| 1 | Scale |
| 2 | Open report |
| 3 | Save report |
| 4 | |
| 5 | Search for text in report |
The Save report and Open report buttons are worthy of special attention. If the ATM Monitoring Reports component cannot access a printer or the report must be saved electronically for later viewing, you can save the report as a file with the .frp, .xls, .xml, .rtf, or .html extension. This file can later be opened on another workstation.
Overview
Content Tools


