Documentation for WEB Report System PSIM 1.0.1.

Previous page Selecting a type of reports by Visitors counting detectors  Creating Visitors counting report with the point of sale data Next page

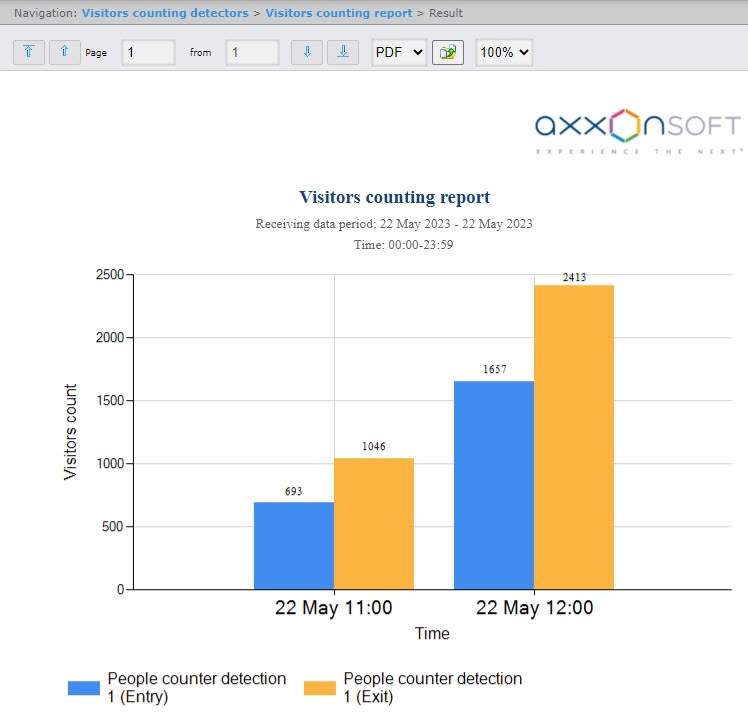
The Visitors counting report allows getting the data about the number of entering people. The data can be presented as a table or as a graph.

Note

The Visitors counting report is related to the People counter detection, it is necessary to create the corresponding object in the DetectorPack PSIM software (see Configuring the People counter detection module).

To create a Visitors counting report, do the following:

  1. Select the Visitors counting report report type (see Selecting a type of reports by Visitors counting detectors). As a result the dialog box for specifying the report parameters will be displayed.
  2. Set the report parameters in the following way:
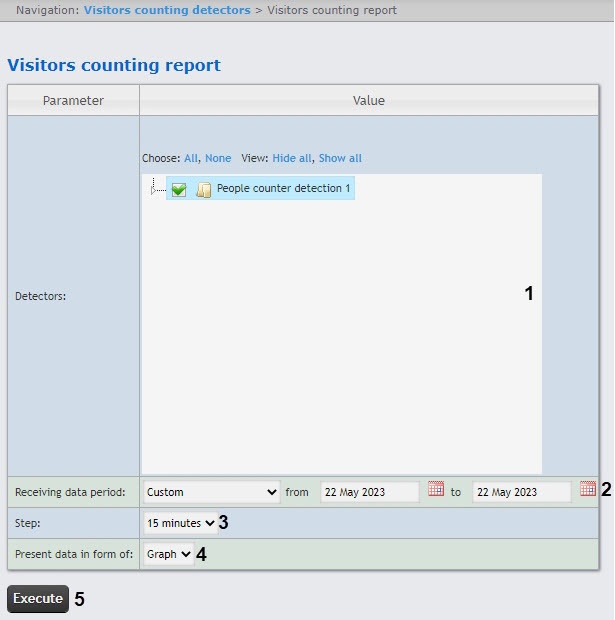
    1. In the Detectors field (1) set the checkboxes for those People counter detection objects which data should be displayed in the report. You can also set the Entry and/or Exit checkboxes to build a report on the number of entered and/or exited visitors.

    2. From the Receiving data period drop-down list select the time period for which the report is to be created (2). 
    3. If the Custom period is selected, enter the date of start and end periods for which the report is to be created in the from and to fields using the Calendar tool. Click the  button near the corresponding field to use the Calendar tool.
    4. From the Step drop-down list (3) select the time period during which the values received from people counter detector will be summed (depends on the Receiving data period parameter, see 2.b). 
    5. From the Present data in form of drop-down list (4), select the report format: Table or Graph.
  3. To create a report click Execute (5).
    As a result the report with specified parameters will be displayed.
    The example of the report for the current day period as a graph:

    The example of the report for the current day period presented as a table: