Go to documentation repository
Previous page
![]()
![]() Next page
Next page
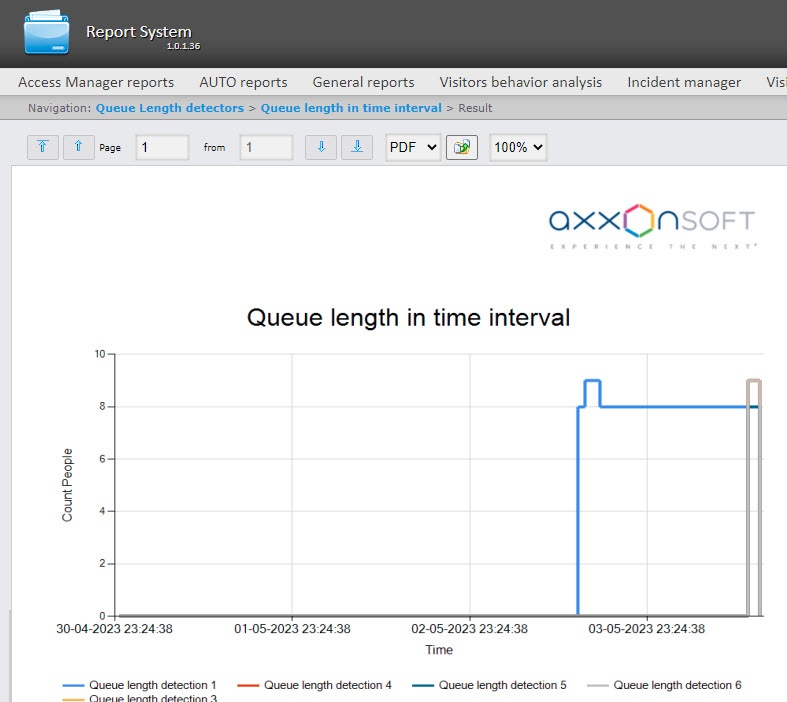
The Queue length in time interval report provides the information on the queue length in time interval. The data can be presented in the form of a chart or a table.
Note
The Queue length in time interval report is a part of the Queue length detection module, it is necessary to create and configure the corresponding object in DetectorPack PSIM (see Configuring the Queue length detection module).
To create the Queue length in time interval report, do the following:
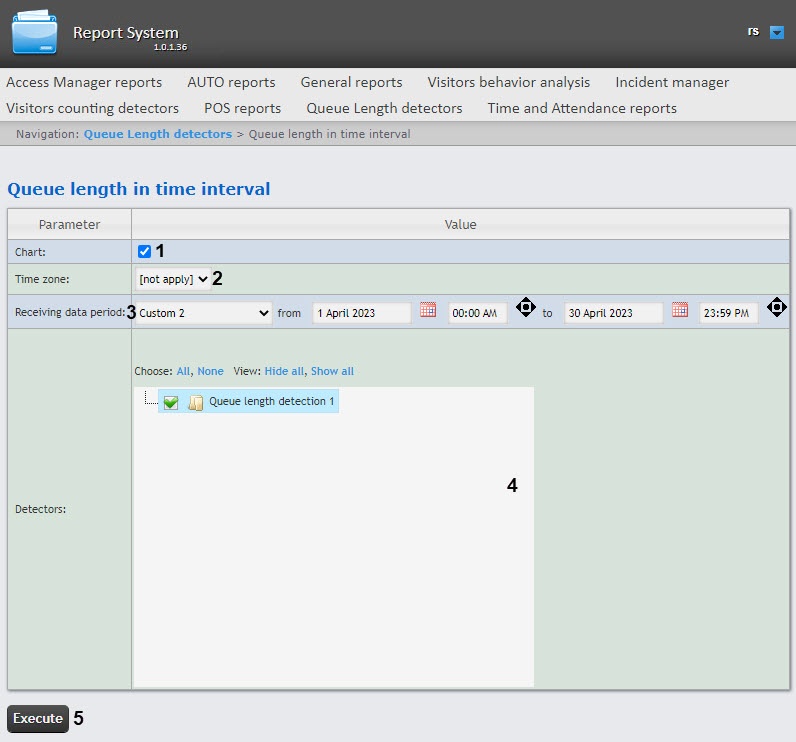
From the Time zone drop-down list (2), select the time zone for which the report should be created.
Note
You can select time zones created in Axxon PSIM that have only one time period and don't have any nested time periods. You cannot select days of the week. For detailed information about creation and using time zones, see Creating and using time schedules.
 button near the corresponding field to use the Calendar tool. If the Custom 2 period is selected, enter additionally the start and end time of the period for which the report should be created using the
  button.
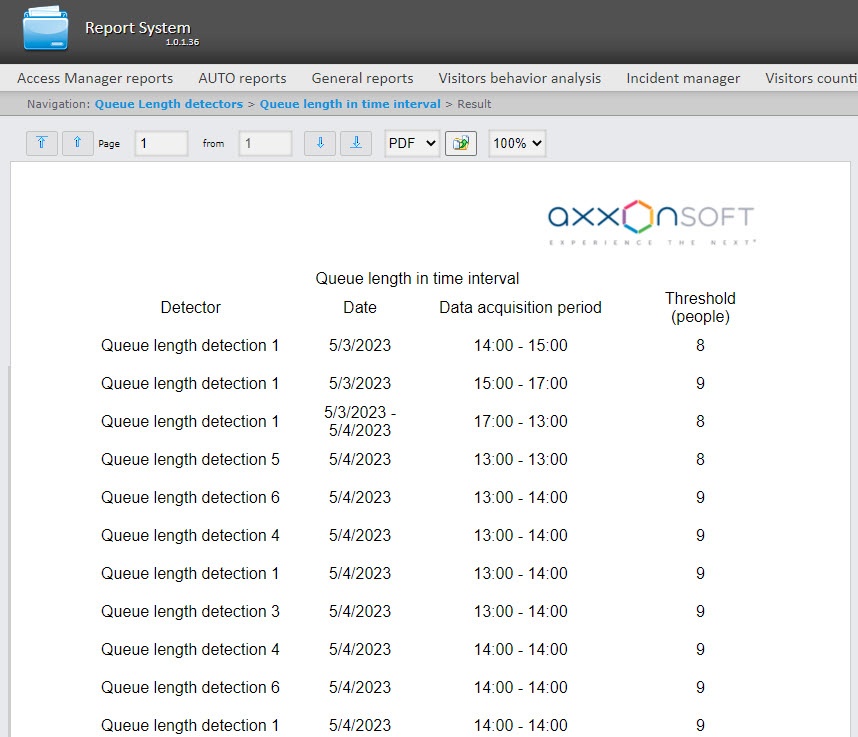
Example of the report in the form of a table:
Example of the report in the form of a chart: