...
To create the Graphic report on events, do the following:
- Select the Graphic report on events (see Select the type of general report).
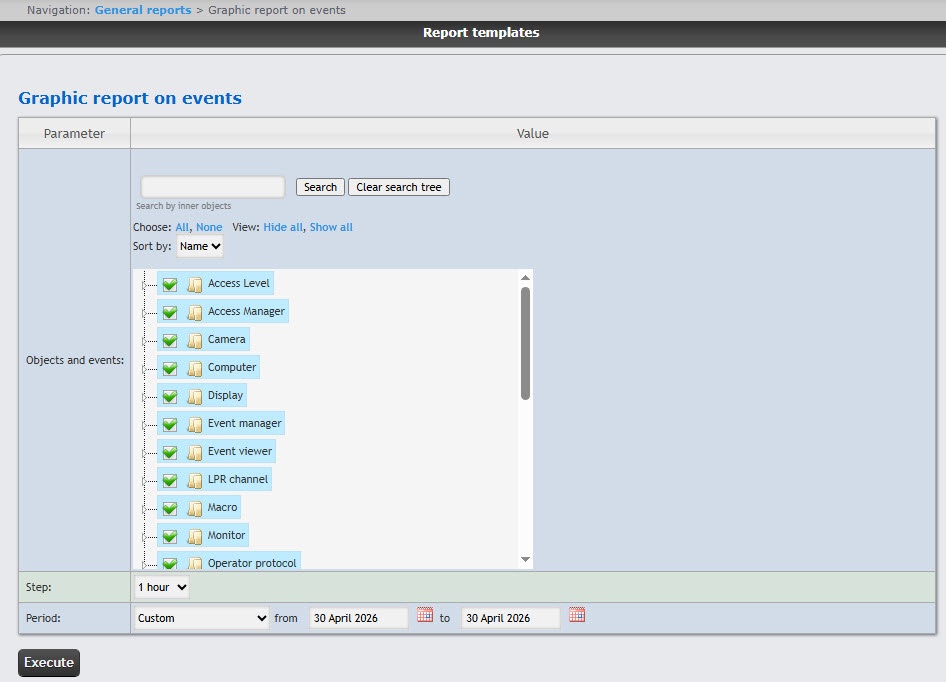
In the Objects and events field, set the checkboxes next to the objects and their events whose information must be displayed in the report. You can select any event by expanding the object type list or by searching for internal objects. To select all found objects and events, click All; to deselect, click None. To expand the object and event structure, click Show all; to collapse, click Hide all.
- To search for internal objects, enter the name of the object you are looking for in the search field (minimum four characters) and click the Search button. To cancel the search, click the Clear search tree button.
- By default, the objects and events list is sorted by name. To sort by number, select this option from
the - the Sort by drop-down list.
To select all found objects and events, click All; to deselect, click None. To expand the objects and events structure, click Show all; to collapse, click Hide all.-
From the - From the
- Period drop-down list, select the time period for which the report must be created.
- If you select
the - the Custom period, enter the dates of the start and end periods for which the report must be created in
- the from and to fields using the Calendar tool.
- From the Step drop-down list, select the time period during which the data for the report are summarized. The list of available steps depends on the selected period.
- To create
a - the report, click the Execute button.
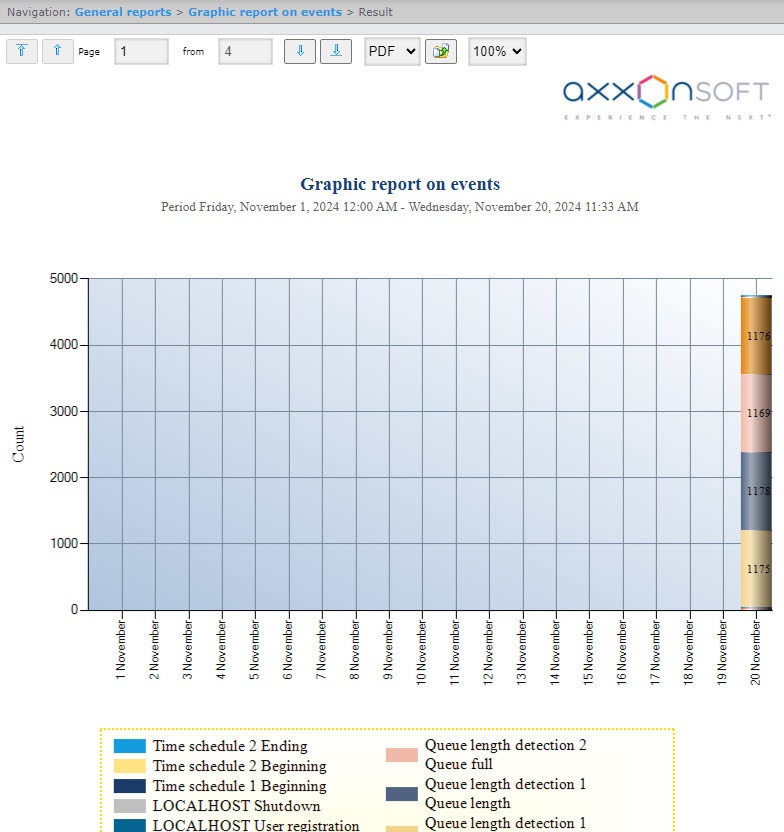
Example 1. Graphic report on events for the current month with a step of 1 day.
...