| Info |
|---|
|
You can use templates when you create a report. To add a new template, click Report templates→New template and fill in the Name and Description fields. The template will use the selected parameters of the current report. Templates work the same way as templates in the scheduler and can be used interchangeably. When you create a response using a template, click Report templates at the top of the page and select the required template from the list of saved templates (the required template is highlighted). As a result, the parameters of the current report are updated according to the selected template. |
To create the Graphic report on events, do the following:
- Select the Graphic report on events (see Selecting Select the type of general report). As a result the dialog box for specifying the report parameters will be displayed.
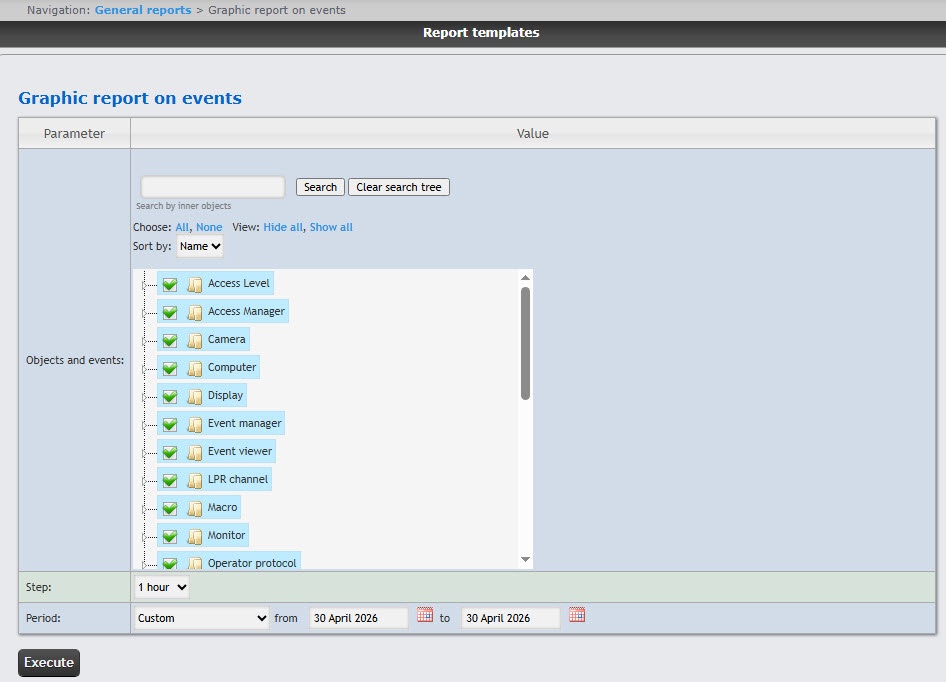
In the Objects and events
field, set the checkboxes
next to the objects and their events
whose information
must be displayed in the report.
You can select any event by expanding the object type list or by searching for internal objects. To select all found objects and events, click All; to deselect, click None. To expand the object and event structure, click Show all; to collapse, click Hide all.
- To search for internal objects, enter the name of the object you are looking for in the search field (minimum four characters) and click the Search button. To cancel the search, click the Clear search tree button.
- By default, the objects and events list is sorted by name. To sort by number, select this option from the Sort by drop-down list.
- From the Period drop-down list,
| Info |
|---|
|
You can select any event by expanding the object type list. |
- To search for the inner object, enter its name (at least 4 characters) into the search field (2) and click the Search button (3). The found object will be displayed in the search tree (4).
- Click the Clear search tree button (5) to remove the objects from the search tree.
- From the Step drop-down list (6) select the time period during which the data for the report will be summarized. The list of available steps depends on the selected period (3).
From the Period drop-down list (7) - select the time period for which the report
is to - must be created.
- If
the - you select the Custom period
- , enter the
- dates of the start and end periods for which the report
- must be created in
- the from and to fields using the Calendar tool.
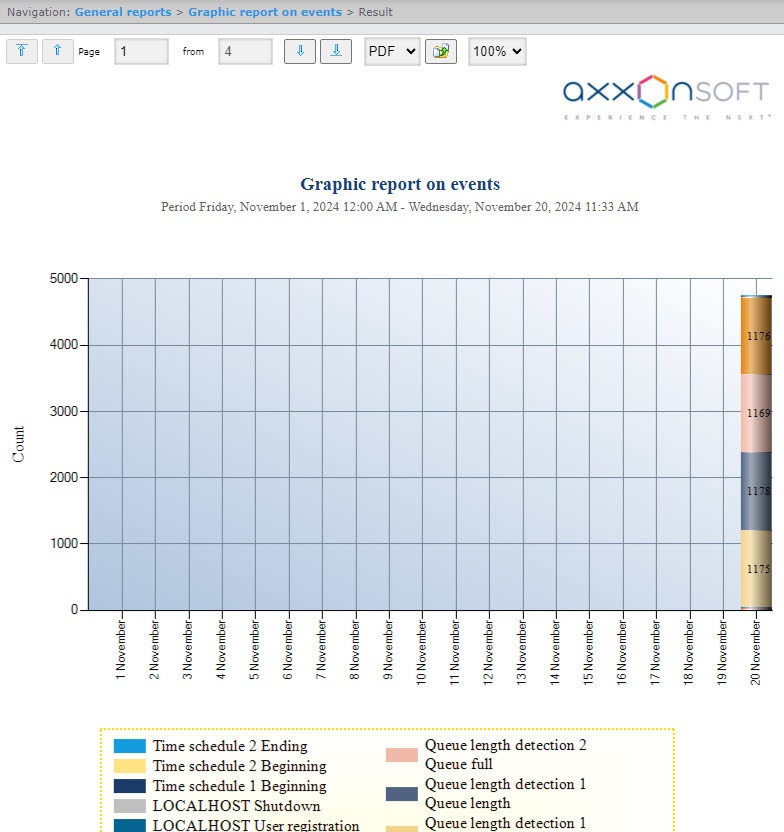 Image Removed button near the corresponding field to use the Calendar tool
- From the Step drop-down list, select the time period during which the data for the report are summarized. The list of available steps depends on the selected period.
- To create
a - the report, click
Execute (8). As a result the report with specified parameters is displayed- the Execute button.
Example 1. Graphic report on events for the current month with a step of 1 day.
Image Added
Example 2. Graphic report on events with a custom period and a step of 1 hour.
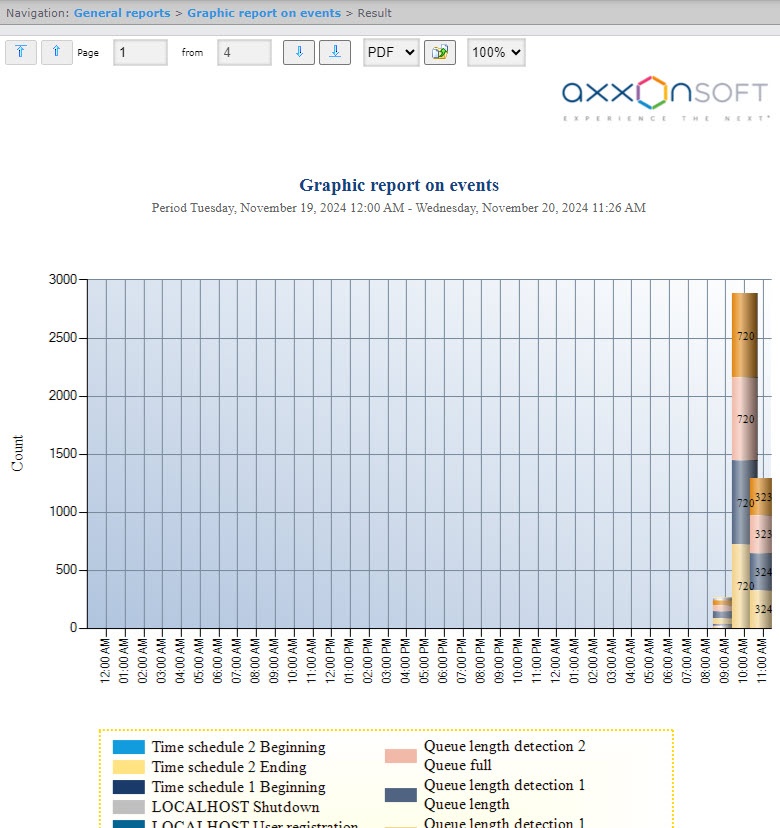 Image Modified
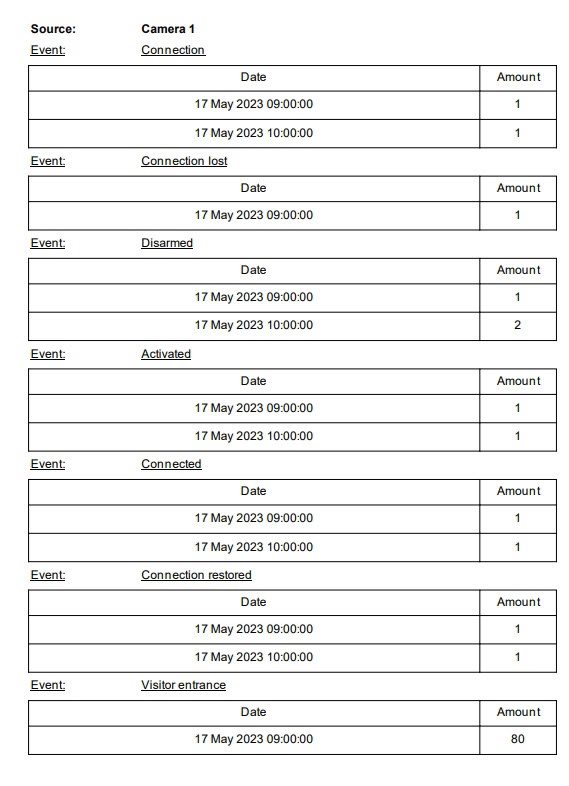
If you export the report
...
(
...
see Export of reports), the report file
...
also
...
contains the
...
event table, sorted by the event source. This table contains the event name, event date, and number of events
...
for each event source.
The Graphic report on events is created.