
Go to documentation repository
Previous page Next page
Note
You can use templates when you create a report.
To add a new template, click Report templates → New template and fill in the Name and Description fields. The template will use the selected parameters of the current report.
Templates work the same way as templates in the scheduler and can be used interchangeably.
When you create a response using a template, click Report templates at the top of the page and select the required template from the list of saved templates (the required template is highlighted). As a result, the parameters of the current report are updated according to the selected template.
The Face counter report (detailed by cameras) allows you to get data on the number of the captured faces (visitors) using the data from the cameras. The data can be presented as a table and as a graph.
Note
The Face counter report (detailed by cameras) is a part of the Camera object. You must first create and configure the corresponding object in Axxon PSIM (see Creating and configuring the Camera object).
To create the Face counter report (detailed by cameras):
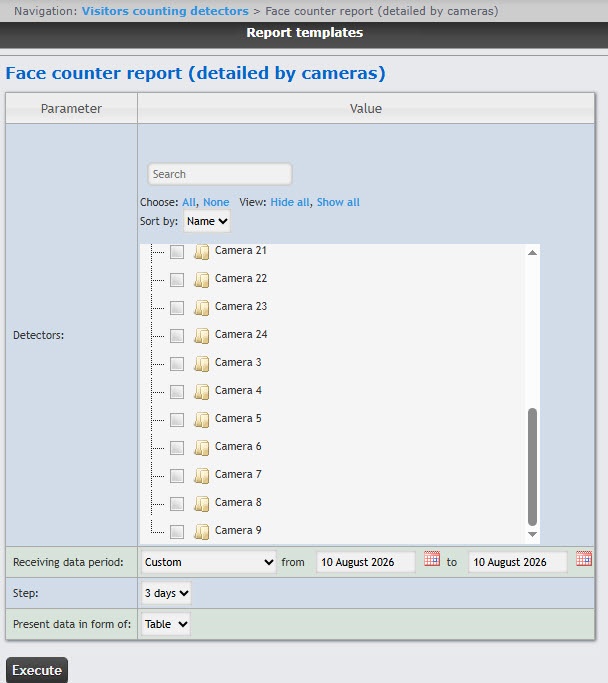
In the Detectors field, set checkboxes next to those Camera objects whose information you want to include in the report. Click All to select all found cameras. Click None to deselect. Click Show all to expand the camera structure. Click Hide all to hide the camera structure.
To use the search when selecting a camera, in the search field start entering the camera name. The search works starting from the first character. The results are highlighted in a different color.
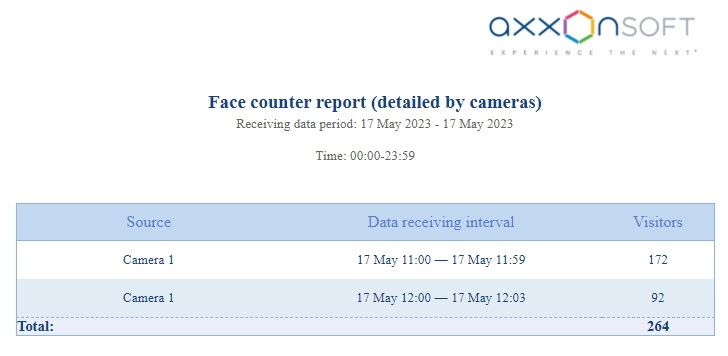
Example of the Face counter report (detailed by cameras) in the form of a table.
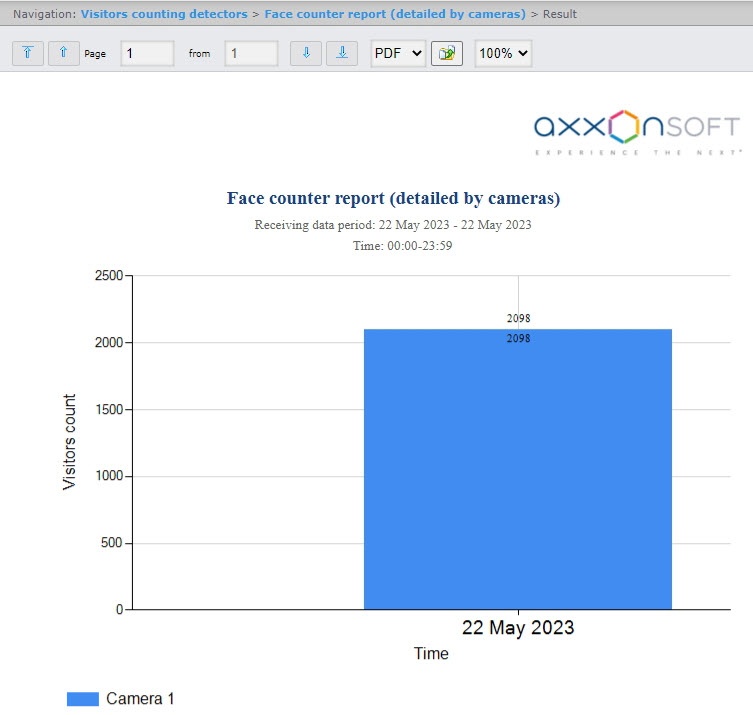
Example of the Face counter report (detailed by cameras) in the form of a graph.
Note
The number of visitors in the report means the number of captured faces, not the number of unique visitors.

