Documentation for WEB Report System PSIM 1.0.1.

Previous page Next page

Note

You can use templates when you create a report.

To add a new template, click Report templates New template and fill in the Name and Description fields. The template will use the selected parameters of the current report.

Templates work the same way as templates in the scheduler and can be used interchangeably.

When you create a response using a template, click Report templates at the top of the page and select the required template from the list of saved templates (the required template is highlighted). As a result, the parameters of the current report are updated according to the selected template.

To create the Visitors activity statistics report:
  1. Select the Visitors activity statistics report (see Select the type of Visitors behavior analysis reports).
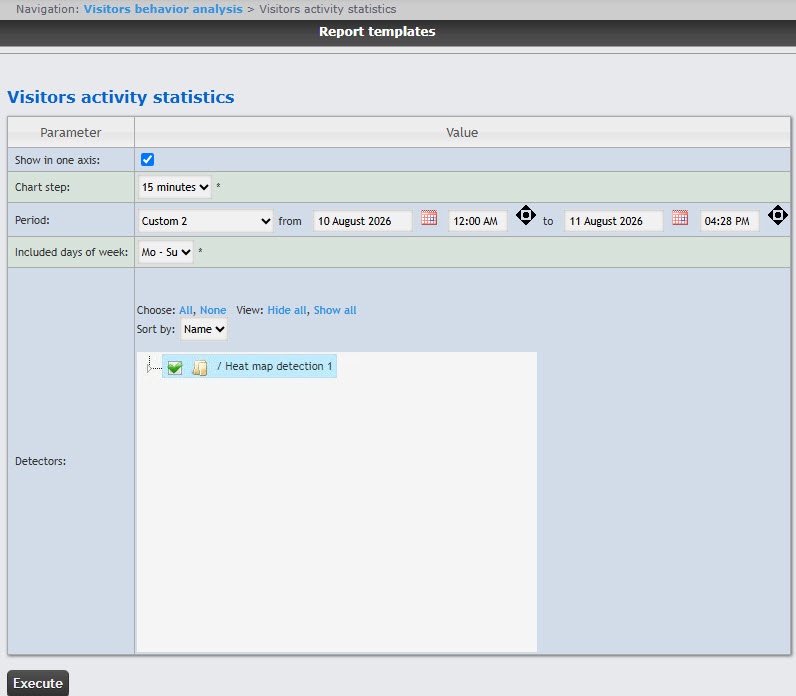
  2. Clear the Show in one axis checkbox if you don't want the data from different areas to be displayed in a single chart. By default, the checkbox is set.
  3. From the Chart step drop-down list, select the time interval in which data will be averaged. The list of available steps depends on the selected period.
  4. From the Period drop-down list, select the time period for which the report must be created.
    1. If you select the Custom 1 and Custom 2 periods, enter the dates of start and end periods for which the report must be created in the from and to fields using the Calendar tool. 
    2. If you select the Custom 2 period, additionally enter the start and end time of the period for which the report must be created.
  5. From the Included days of week drop-down list, select the days when most customers work/don't work to consider in statistics.

    Note

    If the data period and the specified included days of the week don't overlap, an empty report is created, and a message prompting to change the Included days of week parameter or specify another Period is displayed.

  6. In the Detectors field, set the checkboxes next to the areas, the information on which must be displayed in the report. Click All to select all detectors from the list. Click None to deselect. Click Show all to expand the detector structure. Click Hide all to hide the detector structure.
  7. By default, the list of detectors is sorted by name. To sort by number, select this option from the Sort by drop-down list.
  8. Click the Execute button to create the report.

Example of a Visitors activity statistics report.
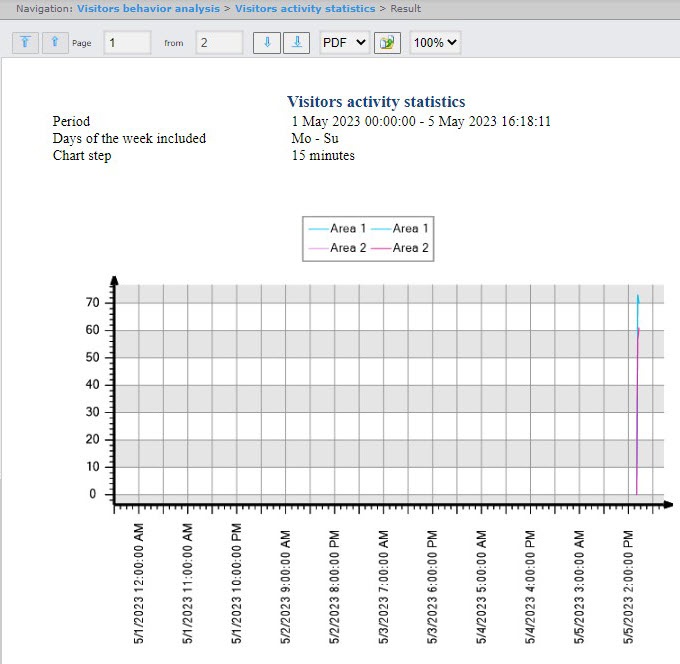
 

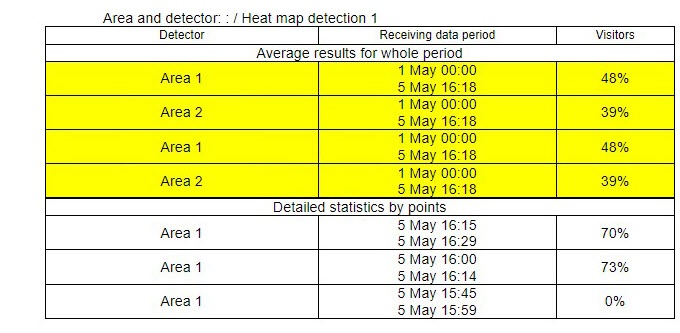
The report displays the average customer activity by areas for the whole period and the detailed statistics on customer activity for each time interval.