To configure the Traffic analysis monitor window, do the following:
- Go to the Interfaces tab of the System settings window.
- Select the Traffic analysis monitor object in the object tree.
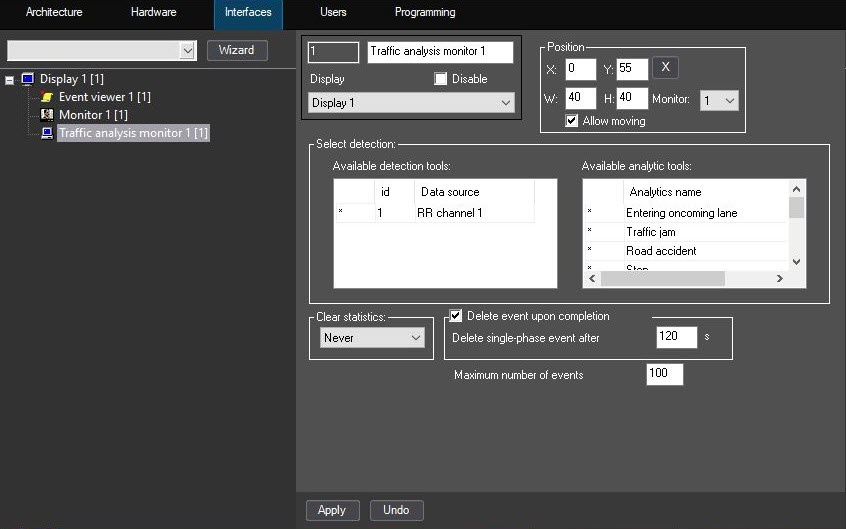
- Use the mouse to enable the required detectors from the Available detection tools list. In this case, an asterisk appears on the left.
- For enabled detectors, all analytics in the Available analytics tools list are selected by default (marked with asterisks). You can change the selection by removing asterisks from the analytics using the mouse.
- If necessary, change the periodicity of the statistics clearing by selecting it from the Clear statistics drop-down list:
- Never (default)—Statistics aren't cleared.
- Each day—Statistics are cleared daily at 00:00 local time.
- Each week—Statistics are cleared weekly at 00:00 local time.
- Each month—Statistics are cleared monthly at 00:00 local time.
- The Delete event upon completion checkbox is set by default, and a two-phase event is deleted from the Events tab of the Traffic analysis monitor interface object when its final event occurs. When the checkbox is clear, the event is deleted from the tab only after the limit in the Maximum number of events field is exceeded.
- If you set the Delete event upon completion checkbox, the Delete single-phase event after _ s field becomes available for editing. The default value is 120.
- In the Maximum number of events field (the default value is 100), specify the upper limit at which events are deleted from the Events tab unless the Delete event upon completion checkbox is set.
- Click the Apply button to save the settings.
Configuration of the Traffic analysis monitor window is complete.