
Go to documentation repository
Select objects to display on the chart and set the number of points as follows:
- Go to the Charts object settings panel.
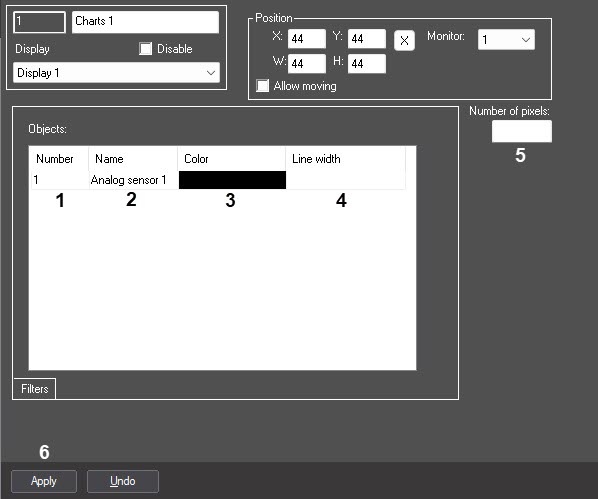
- From the Number drop-down list, select the Analog sensor object ID according to the preset analog sensor (1). See also Creating and configuring connection with the Analog sensor (input).
- The Name is filled automatically after ID selection (2).
- From the Color drop-down list, select the color to mark the sensor readings on the chart in the Charts window (3).
- In the Line width field, enter the line width in pixels (4). The value must be integer: if you enter an incorrect value, the default line width (5 pixels) is applied.
- In the Number of pixels field, set the number of points to display on the chart (5).
- Click Apply (6).
Selecting objects to display on the chart and setting the number of points is now complete.
Overview
Content Tools